|
Preliminary Report on MADAR
Detection Francis L. Ridge, Director A modest approach to potential UFO detection and possible correlation with local UFO reports was begun in 1970 and was terminated after a little over twenty years. The period of the data studied covers the first and last detected anomaly before the equipment was shut down and dismantled, a total of 26 anomalies. The first anomaly was recorded on September 8, 1970; the last on September 13, 1990. MADAR is an acronym which stands for "Multiple Anomaly Detection and Automatic Recording". The fixed detection site for the MADAR unit was Mt. Vernon, Indiana, except for the first few months of operation in latter 1970, when the site was located 50 miles north at Vincennes. By the end of the Project, a total database of just over 4,000 sighting entries had been completed, comprising events from prior to the era of 1947, to the present day and covering activity in a six state region. The states included in the Regional Sighting Information Database (RSID) were Missouri, Illinois, Indiana, Ohio, Kentucky and Tennessee. The scientific value of the data presented was considered extremely good since four of the six states were on the top ten list of Close Encounters. Before we get into the MADAR data I would like to share
some information gathered in the process of writing this
report not dealing with MADAR years.
About 6% of the Regional Sighting Information Database involves events which allegedly occurred during the wave of 1897, most of which happened in a six-week period and all over the United States. For this report we will only be concerned with later incidents, referred to by many as the "UFO era" and then concentrate on the MADAR period itself since MADAR was in use only during a twenty year period from 1970-1990. And, again, this is a six-state study, not a national one. The graph considers the UFO phenomenon from 1940 onward, although there were some sporadic, but good reports, between the turn of the century and 1940. The peaks and sighting waves were pretty well recognized for the first 35-40 years, at least on the U.S. level. The regional graph simply confirms what most of us already knew, except for the last twenty years. However, some researchers were not aware that 1967 was a significant hidden wave year. We noticed this on a local and regional level early in the research and later ran across a paper by Richard Hall where he referred to it as the "overlooked wave of 1967". Also of note, 1952 was a national sighting wave peak year with 1501 sightings reported to the Air Force, many of which turned out to be some of the best "unknowns" on file. Regionally, the peak is less prominent than I expected. In national graphs 1952 is a noticeable peak. The same thing was noticed for 1957. The regional graph lacks the vertical amplitude of the national plots. The apparent decrease in UFO sightings and subsequent
decline in interest is evident during 1979 and the early
1980's. Based on this graph it is logical to assume that
UFO activity was actually down or that UFO activity
became more covert during those years. With the
"discovery" of the abduction phenomenon in the 80's it
appears that the latter is a good possibility, albeit
unproven. Interest in UFOs waxes and wanes, often due to
media coverage, but sightings are not always connected
with publicity. UFO sightings began to increase in the
mid-80's and some of those reports were spectacular
encounters and abduction reports.
As apposed to Close Encounters, where the object is within a 500' or so of the witness, Distant Encounters are those that occur at distances greater than 500', usually much greater. And more often than not, the description of the objects themselves are of lights in the sky. This group is divided into two categories: Daylight Sightings. Those seen in the daylight hours are commonly referred to as "Daylight Discs", even though they may be anything but disc-shaped. I think it is more appropriate to use the term Daylight Sightings. However, computer database records will continue to use the two-letter designation "DD". It is interesting to note that most light encounters appear to fit the common flying saucer description. And many of the sightings during the wave of 1947 were described by the witnesses as "flying discs". Night Sightings. Those seen at night are referred to as "Nocturnal Lights". Most NLs turn out to be IFOs (Identified Flying Objects), sometimes not even flying, as in the case of repeated sightings of the planet Venus being reported. Here the ability to positively identify an object in the very beginning becomes a lot more difficult, many times impossible for the witness not aware of the many possible stimuli. Upon closer scrutiny it appears that daylight discs (DD) and nocturnal lights (NL), all distant encounters, were equal during the wave of 1947. This was somewhat of a surprise as it appeared earlier that daylight disc sightings dominated the 1947 wave. At least for the Midwest the numbers were fairly evenly divided. Most noticeable peak years for the distant sightings were: 1947, 1952, 1957, 1967, and 1973. Sightings (at least the reports of) died down after the late 70's, with a prominent resurgence in 1986. Peak years for the daylight sightings (DD) pretty much
followed the normal overall pattern in the early years,
roughly matching the night sightings, then remained low
as NLs increased in the 70's. The lull in the 80's is
indicative for both DD & NL cases, but daylight
sightings became rarer and rarer.
As would be expected, more can be determined with the Close Encounter data, as Dr. Hynek always indicated when he suggested we concentrate on this grouping. However, Figure 3 has exhibited some surprises. This graph compares the Close Encounter groups with the Distant Encounter group, and indicates that the distant events are happening and at about the same frequency the nearer ones. Other researchers have shown that the media (press coverage, etc.) has little influence on the production of UFO reporting. The graph above seems to verify this conclusion. With the DE group one would think that you would have more than the average misidentification of distant conventional objects, especially at night. And although this is true, the subset above represents the distant events that remained unexplained after investigation. Of special note, the 1947 wave was definitely a distant encounter wave with a few close encounters. But this started to change in the fifties and coincides with the known peak years. During the genuine UFO waves the distant encounters appear to represent the same phenomena as the close encounters. Many would say that the signal to noise ratio would be ridiculously low during these waves due to media coverage, but the increase in close encounters indicates where the apparent genuine activity is. Please note the years 1967 and 1973. Then look at 1969 and 1971. In 1969 and 1971 distant light and other object counts were up appreciably and close encounters took a nosedive. This could indicate that interest (media coverage) was up, but genuine activity wasn't. The 1980's indicate a better balance of both CE and DE
events. This is somewhat surprising since it was shown
earlier that nocturnal lights sightings had been up and
daylight sightings were down, indicating
misidentification was a bigger factor. That would seem
to indicate that people were mistaking distant
conventional objects for UFOs. But close encounters were
on the upswing.
In Figure 4 we observe CE-I (thin, black) and CE-I I
(blue) cases, which do not involve any sightings of
humanoid beings. But the object is relatively close
(CE-I), and sometimes exhibits or leaves traces of
evidence of its reality (CE-Il). The graph is
interesting in that 1957 had almost an equal share of
CE-I & CE-I I reports. The peak registration
is almost identical, they practically coincide
with each other, in 1957, 1973, and 1978. Of course,
1973 is the best example.
In Figure 5, entities or humanoid beings were
reported on or near a craft in the CE-III group (thin,
black line) and actually interacted with the witnesses
in the CE-IV (red) group. The latter was mostly, if not
all, an abduction scenario. The peak periods for these
two groups are the same, but the differences between the
CE-III & CE-IV groups themselves is astonishingly
different. CE-III, which usually represents incidents
where persons not considered "abductees"
are the witnesses, is where those persons are apparently
in the right place at the right time. In this extremely
rare situation the witness observes humanoids near or on
(in) a craft. CE-IV's, on the other hand, (reports, that
is) are quite numerous and are referred to as abductions
and involve a direct interaction between apparent aliens
and the experiencers. Rather than being at the wrong
place at the wrong time, the abductee is taken from his
home or his car.
From September of 1970 to September of 1990 there were a number of unexplained detection events recorded by MADAR. The Multiple Anomaly Detection and Automatic Recording system, a magnet variometer, was activated 26 times. In two instances there were significant increases in background radiation. Three events were downgraded in significance. One of those involved a very close lightning strike and accompanied by a strong magnetic field. This incident was immediately explained by the almost instantaneous clap of loud thunder found on one of the event recording devices. In another instance the equipment was jarred by accident. In the third explained case we downgraded the incident because the region had been shaken by numerous earthquakes for the next two days. Even though legitimate UFO activity could precede or coincide with geological activity, with lack of direct evidence we must assume that the sensor was activated by geological disturbances. The equipment was not in operation in 1971 and 1972
since I had been transferred to two Illinois cities
where equipment site locations were not suitable.
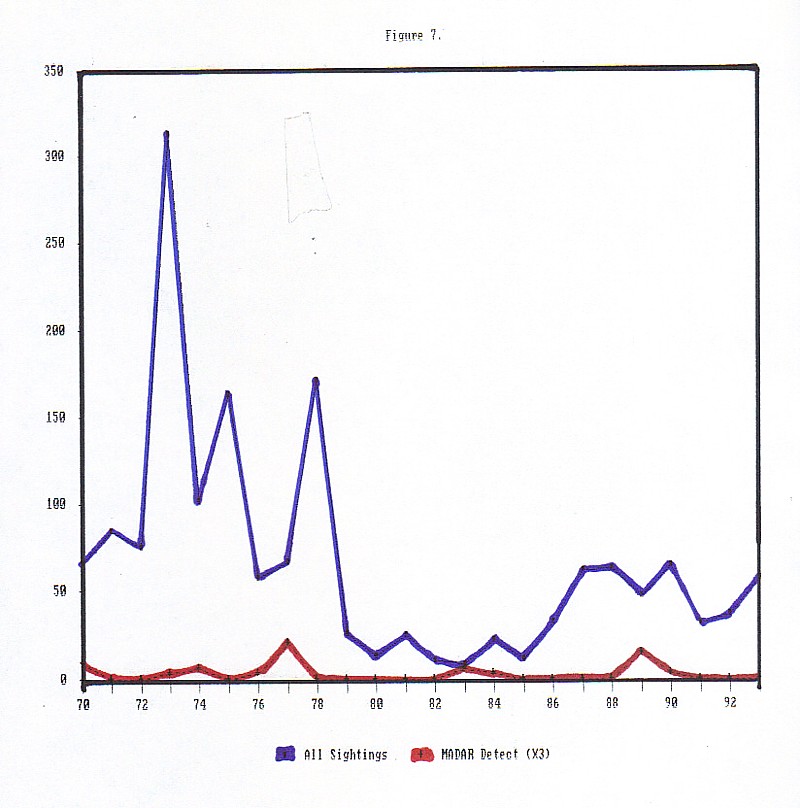
For this study, the following set of graphs are limited
to the MADAR years, 1970-1993. Initially we had hoped
for a local correlation, a MADAR detection with a
confirmed nearby sighting. This would hopefully be a
localized direct cause-and-effect relationship that
would be hard to ignore. But a regional situation
where MADAR was acting as an additional impartial
witness, operating in a totally different spectrum
during UFO waves in the Midwest was far from our minds.
Figure 7 is not too impressive and shows an out-of-phase
relationship in many places. In fact, in this graph of
sightings in the six state region, except for the 1973
wave where MADAR (red line) was triggered during peak
activity (unable to display in Figure 7), and the 1977
local "concentration" where there was no actual
large-scale sighting wave, but leading to the 1988 wave,
all the MADAR events seem to precede the UFO
events by one year, more or less. But this could simply
be that there are no correlations with regional or
national all-category sightings and local MADAR
detections. Or, are the all category plots masking the
Hynek type related to MADAR detections?
MADAR detections (red) become even more interesting
when distant encounters (black) are isolated from close
encounters (blue). The out-of-phase effect is the same,
but the "correlation" is more prominent. Note that a
single MADAR event, such as the local event in 1973, has
no amplitude to speak of on the graph above, but the
MADAR equipment had been sitting idle all year and was
actually triggered during the wave peak. This was the
most interesting correlation, but the most noticeable
were the ones in 1977, where, in thirty-five days there
were seven MADAR events. Was there a local correlation
in either case? Nobody reported a UFO locally at the
time of the events. If it was the result of what I call
the "rain gauge effect", then something was happening at
the same time over the entire region, or larger! There were close encounters in 1973, in fact a very
good local CE-II case with electro-magnetic effects.
This involved an L&N
Train Crew. MADAR didn't detect this one, but the
event took place about 5-8 miles from our MADAR site and
very probably out of range. But the sole MADAR event of
1973 took place on Nov. 1, at 9:47 PM, right in the
peak. (Note: Regarding the wave, previously, on October 11, five days after the Middle East War had broken out, the North West Cape along with other U.S. bases in Australia were put on full alert. This fiasco climaxed early on the morning of October 25, 1973, in Washington D.C., when a full nuclear alert went out to all U.S. forces. North West Cape was used to communicate the alert to both conventional and nuclear forces in this region. The acute security alert status "Def Con 3" was reached.) The cases in 1977 were all distant encounters. At least
no one came forth with a close encounter report. And no
reports were filed by anyone close to the MADAR site.
All the events took place outside the normal range of
MADAR's sensor. However, the reports we did get were
verified by police dispatchers within 50 miles of the
MADAR station. Right at the time MADAR was picking up
anomalies locally, there were sightings of
strange objects reported to police departments from
Illinois and Kentucky, regionally. The very best
event detected by MADAR was a 3-minute, 29-second
disturbance with a 100% increase in background
radiation.
Leaving out the entity encounters, and concentrating on
simpler close encounters (CE-I & CE-II, blue),
there appears to be no correlation. This leaves us with
only the entity-type encounters, CE-II & CE-IV to
consider as a possibility.
Possible correlations emerge. CE-I I I & lV events are probably the most important cases we have. If we are interested in alien command structure and modus operandi , these incidents are the ones we need to study very, very closely. If UFOs are spacecraft, "somebody" is very probably inside these craft. If beings are reported, as they are in these two categories, this data has to tell us something. The graph, indeed, shows suspicious correlations, even though the database contains such small numbers of reported events. The graph tells us that when MADAR is detecting anomalies locally (red), entity-type events (blue) are occurring in the wider region! Even though there is still a nagging time-delay effect, the graph is suspicious. If true, this could indicate E-M events are tied to entity cases, and that the incidents may be occurring as part of an abduction wave, rather than random events. The big problem we run into here is the rarity of
CE-III s and the lack of information and time delays on
CE-IV's which is better explained at the end of
this brief report.
CE-I I I 's (blue) are extremely rare incidents, but
they are also interesting and fascinating. This is where
the witness(es), without the need for hypnotic
regression, has conscious memory of observing entities
on or near the craft. One of the best examples on file
is the Lonnie Zamora
/Socorro, NM case of 1964. But with the present rare
collection in the database, Figure 11 doesn't show the
correlation one would expect. MADAR events are red.
That leaves us with CE-lVs (blue). There is no doubt that MADAR (red) is picking up "something" truly anomalous and on a local level. Evidence indicates there is some kind of connection with UFO activity, sometimes locally, other times regionally. With Figure 12 above we have filtered out all the distant encounters and all of the close encounters, including CE-III, but leaving only CE-IV's. Again, these are abduction reports. There appears be more of a correlation here than in any other graph we have produced, but the data is too meager to base any final conclusions on. CE-IV's are usually a series of ongoing incidents with
few concrete dates. It is not unusual for an abductee to
have a half dozen incidents and no firm dates to place
on computer. And many researchers never get around to
filing the reports because they are incomplete
and ongoing! Any many completed cases are not filed, but
hoarded by the investigator who is writing a book or
busy collecting information on other abduction incidents
he or she has become aware of. Before we can assess any
real value to this study we must seek more and better
statistical data and await the compilation of the data
from the Abduction Transcript Project and Abduction
Database Project being conducted by MUFON. In the
meantime I strongly urge the procurement of some type of
detection equipment for use in locations where there are
potential abductees. |
|||||
|